This post is going to be long like all my math posts but I promise there's good info here so keep reading for a lot of fun graphing activities and ideas! :)
My favorite way to introduce graphing is with whole group graphing on the pocket chart with questions kids answer each day. I have a bunch of different question cards with category (answer) cards to go with them so you just set up the question at the top of the pocket chart and the categories at the bottom each morning.
Then, kids come in and answer the question by taking their card they made for themselves and putting it above the category. I love these little kid cards. I made several different variations for boys and girls so they can pick the one that they think looks most like them, color it to look like them, and write their name on it. They only do it once then use that card for all the whole group graphing activities you do during the year!
One way I love to use this is as an attendance activity! When they come inside in the morning, they put away their stuff then go get their card to answer the question. It's a quick way to check attendance (just look at which cards weren't used), answer the graphing question, then get back to their morning work. It takes up pretty much no instructional time and gives them a task to do immediately when coming in which is great!
At calendar or whole group math time, you can go over the results and analyze the data. You could also do the questions and kids putting in the answers during your lesson too. It can be such a quick activity that doesn't take up a lot of your instructional time but gives so much practice with graphing.
Ask questions like, "How many people picked _____?" "Which ____ do the least of you like?" "Which ____ do the most of us like?"
After about a week, start throwing in questions like "How many of us like ____ or ____ the most?" "How many more of you liked ____ than ____?" to start introducing those concepts. It's so much easier to explain it and for them to "get it" in this context than with pencil and paper later!
I made 27 different questions for almost a month worth of daily graphing practice. I tried to make them fun like what kind of superpower would you want or what would you do as principal. :) Most of the questions have 6 categories to choose from. You can use all 6 or just do 3 or 4 at a time or however you want to do it. There are a lot of ways to use them!
Kids love talking about themselves and sharing things so I love this activity for that purpose. Every single day, they get to share something about themselves through this activity and feel included in the lesson. It's a great way to get to know your kids! If you have a few extra minutes in your lesson, have them tell the person next to them on the carpet what category they picked and why, then pick a few kids to share with everyone. It's truly a classroom bonding experience the kids love. You can also have them talk to their partners about what they notice about the graph which is an AWESOME opportunity to get them to use math talk - model some observations for them ("I notice the most people like ice cream. What do you notice?" "I noticed that the least amount of people liked donuts.") Once they get good at it, you can even have them ask each other questions like, "How many people liked cake the most?"). It's using THEM and their friends as data about what THEY like so trust me, they're engaged and want to talk about it. :)
Kids love talking about themselves and sharing things so I love this activity for that purpose. Every single day, they get to share something about themselves through this activity and feel included in the lesson. It's a great way to get to know your kids! If you have a few extra minutes in your lesson, have them tell the person next to them on the carpet what category they picked and why, then pick a few kids to share with everyone. It's truly a classroom bonding experience the kids love. You can also have them talk to their partners about what they notice about the graph which is an AWESOME opportunity to get them to use math talk - model some observations for them ("I notice the most people like ice cream. What do you notice?" "I noticed that the least amount of people liked donuts.") Once they get good at it, you can even have them ask each other questions like, "How many people liked cake the most?"). It's using THEM and their friends as data about what THEY like so trust me, they're engaged and want to talk about it. :)
I actually recommend doing the daily graphing a few weeks before you actually start your graphing unit so they'll have a ton of exposure and practice to graphing and answering questions beforehand and, like I said, it can be a quick thing during calendar or before your whole group lesson to analyze the data in the graph.
Once you are ready to teach graphing, they will be all warmed up and know how to read and answer questions about graphs!
Bar Graphs
The first step is to have them create their own bar graph using data. Give them a Level A (the level of my worksheets can always be found in the star in the upper right corner of pages) worksheet that has them look at the pictures and color in the bar graph to show how many of each.
I recommend having them color in each insect a different color then use that color to color in the bar graph. This will help them easily see and interpret their data which will help them when they start answering questions about their graphs later on.
I also recommend doing a simple worksheet like this for both vertical and horizontal bar graphs so they see that the graph can go either way.
As you can see, graphing the insects was a horizontal bar graph and pet shop pets is a vertical bar graph so students can see that both orientations can be used to display data. I think it's important for them to see all the ways graphs are represented so when they encounter them, they know what to do.
Data Analysis
Okay, so now they're ready to add the skill of analyzing their graphs!
Give your students who struggle the Level A worksheet to create their bar graph like they've done before. Then, they write how many of each ocean animal they saw on their sheet. Last, they answer the question by coloring in the ocean animal they saw the most.
For your on level kids, give the 2 Level B worksheets (notice the B in the star in the top right corner). The first sheet has them tally how many of each animal they saw then create a bar graph using that data.
THEN, they also get a question sheet. Hopefully you've practiced these types of questions in the whole group graphing pocket chart activities I showed above so that they're familiar with the vocabulary and types of questions that are asked about graphs. That's why I recommend doing it for a few weeks before starting your graphing unit. It's okay if you didn't and need to teach graphing now, though! Just do a few of the questions whole group to introduce the vocabulary and question types with the visuals. It's so much easier with visuals!
For your high kids, challenge them with the Level C questions sheet! As you probably know from my How to Keep Gifted Kids Engaged and Learning post, I'm really passionate about differentiation and making sure all kids feel challenged but in fun ways!
As you can see, the Level C (note the star in the corner) worksheet asks a lot more questions they have to think about to answer but uses the same data as the Level B sheet. When you differentiate for your higher (or lower) kids, you want the activities to be the same so they feel connected to the lesson and to their peers and don't feel "different." That's why I always try to provide the same activity but alter the levels so everyone can take part and feel challenged at their own level.
You could also start all of the kids off with the A worksheets, work up to B together, then do C together to scaffold the learning. Working your way up with each level can get even your most struggling kids to be successful with the higher level thinking questions and concepts.
Okay so now it's time for the fun stuff - math centers!!
Heads or Tails is an easy center! Simply give kids a penny, have them flip it and color in a box for the side that won. They keep flipping and coloring until one of the sides gets to the top. Once heads or tails reaches the top of their bar graph and "wins," they answer the 2 questions. Easy! You can laminate the mat and have them do it over and over.
You can also have it be a partner game. Have one kid pick heads and one kid pick tails then take turns flipping to see who wins.
Another fun center I love is Grab Sort Graph!
Put 21 cubes in 3 different colors (7 of each color) into a tub. Kids close their eyes and grab a handful (or 2 handfuls if they have really small hands) of cubes and drop them on the table.
Then, they sort the cubes into piles by color and connect them to make a vertical bar graph. I laid them down for the picture but kids love making them into bar graph towers! Then, they color in the bar graph on their paper to show what they grabbed.
There's an optional graphing questions worksheet to go along with it too that they can fill out about one, or both (copy it double-sided), of their grabs.
It wouldn't be one of my math units without some cut and pastes! You know me, I find a way to make every math concept into a cut and paste activity. :)
I think it's important for kids to be able to make a bar graph so for the cut and pastes like this, they put the title where it is supposed to go and each category in the right place based on the data provided. For example, the data box shows 3 ants so they'd put the ant under the bar graph category with 3 colored in. It's a great assessment to see who understands what the graph actually means.
Speaking of labeling a graph, it's also important that they also know the components of a graph so we practice that too.
I also recommend hanging up posters or anchor charts as reference!
How Many More
Speaking of anchor charts, how many more can be such a difficult concept for kids that I recommend making some sort of anchor chart to remind them what it means.
In my opinion, one of the hardest graphing questions that kids struggle with are the "How many More?" questions. This question stumps even the brightest kids but if they understand exactly WHAT it's asking, it can become easy for them. How many more often sounds to them like they need to just add the 2 numbers together.
So how do you teach it??
In small groups, let 2 kids be your examples. Give one kid (Ava) 8 red cubes and another kid (Jack) 5 blue cubes. Say how many does Ava have? 8. How many does Jack have? 5. Okay so now we want to figure out how many MORE Ava has than Jack. Have Ava and Jack link their cubes together in sets of 2 (1 red and 1 blue from each) until Jack runs out of cubes. Then say, "See? Ava still has some left over. So HOW MANY MORE cubes does Ava have than Jack? Let's count them!" and count how many cubes Ava has leftover to show them the concept.
This simple small group activity will help them understand what it's asking when it wants to know how many more. Do it a couple times with different amounts until every kid at your small groups table has had a chance to practice. You can also throw in "How many less did Jack have than Ava?" to use that vocabulary as well if you think they're ready.
I also like to have a few worksheets to assess with paper and pencil so they see the question being asked. Have them circle the sets (or draw lines to connect them) to figure out how many are leftover.
I also like to have a few worksheets to assess with paper and pencil so they see the question being asked. Have them circle the sets (or draw lines to connect them) to figure out how many are leftover.
Since they are basically bar graph masters at this point, let's try some REVERSE graphing!
Now they are the ones creating the data!
Give them this shapes data and ask them to draw a picture that makes the data true. In the box, they'd draw 5 circles, 2 rectangles, 4 triangles, and 6 squares. Simple enough, right?
So now give them this bag of candies and tell them color it in based on the data.
Then have them try coloring in apples on an apple tree using - wait, what are those?! Tallies!
Tally Marks and Tally Charts
I love tallies! Tally charts are a lot of fun because they are so simple. You've probable used them without even thinking on your whiteboard to do Table Points or play Students vs. Teacher (I show both of these classroom management ideas and a bunch more in this post: 20 Classroom Management Strategies You Can Start Right Away)
I like introducing them with pretzel sticks! Kids love food.
Food = Awesome. Food + Math = Still Food = Still Awesome.
Food = Awesome. Food + Math = Still Food = Still Awesome.
Give each kid a handful of pretzel sticks and tell them they can eat them once they're done but not to eat them yet or they won't be able to build all the numbers. :) Lead them into setting out 1 pretzel stick to make 1, make 2, 3, 4, and then show them how to slant the 5th across the first 4. Then, show how you leave a little space to start a new set of 5. Build each number to 10 together. Walk around to make sure they're doing it right. Then, have them clear their space and tell them random numbers to 10 to build then walk around to assess to make sure they build the numbers correctly. Easy, fun, yummy lesson!
You can also create bigger numbers with more pretzel sticks if you want to practice counting sets of tallies by 5s and such.
The Tally Mark Kids math center is a really easy center for kids to review reading tally marks with numbers to 10. They simply look at the tally marks the kids are holding and write the number on their recording sheet.
Another center to practice counting tallies are the glitter tallies puzzles. These practice tallying numbers to 30 where kids simply match the tallies to the number. This is a good time to remind kids that they can count tallies quickly by counting by 5s.
When it comes time to show what they know, I have a ton of tally mark worksheets. First, I recommend having them count the tallies and write the number they represent in the box.
Then, give them numbers and have them draw the tallies to make that number.
Last, mix the 2 skills together for a lot of tally marks practice!
Now that they understand WHAT tallies are and how to read/write them, now they can use them for graphing!
I recommend giving your kids this shapes graph to tally in their level. Level A worksheet:
Yay! They made their very own tally chart! :)
As you can see, I really differentiate everything that I can. I think it is so important for kids to be able to feel successful but challenged at their level. I want every kid in the world to love math so I try to make it as fun as possible while providing support for the kids who need it and a challenge for those who need it.
For example, here is one of the tally charts worksheets I recommend giving to the majority of your kids. Note the level B in the star in the corner. This is for the kids who are on grade level... they get things after explaining once or twice and typically don't struggle with learning new math concepts.
This worksheet has a tally chart where the numbers are within 10. It asks questions they know how to answer from learning about bar graphing.
For your kids who do struggle, give them a Level A worksheet. They are practicing the exact same concept but at their level. The numbers they're using are smaller and the questions are much easier to answer. After they master Level A, definitely let them try Level B but they should definitely be doing Level A to prepare first so they can feel successful.
For your kids who need an extra challenge, give a Level C worksheet. As you can see below, the numbers are much bigger so it is much more of a challenge. It's not always about having bigger numbers - I usually try to provide more challenging ideas or questions but for this one, it's just about bigger numbers because that really does make it a lot more challenging for them to answer the questions (adding them ALL up, subtracting one from another to determine how many more).
Another way to easily differentiate is with centers. For example, with the Tally Dice Roll, you can differentiate by simply giving a different set of directions to different groups.
For this center, kids roll the dice then draw the tallies. For your on level and above kids, have them roll 2 dice and use that to create a 2 digit number. If they roll a 3 and a 2, their number would be 32 so they would write 32 in the circle and draw 32 tallies. For your lower kids, tell them to roll 2 dice then add them together to get the number they draw so they only are drawing tallies with numbers up to 12. For example, if they roll a 3 and a 2, they would add the 2 numbers together to get their number (5) so they'd write 5 and draw 5 tallies.
Another fun activity is using colored craft sticks! Put a handful of 3 colors of craft sticks into a baggie. Do this to make a few baggies to choose from. Have kids in partners simply grab a baggie, sort the craft sticks by color, and make them into tallies (by color) to see how many of each color they have. Then have them ask each other questions about it! How many red, how many yellow, how many more ___ than ___, which has the most, which has the least, how many tallies in all, and so on. You could also write the question frames on the board to guide their math talk!
Cut and pastes are also a lot of fun to practice! I made a couple different ones to practice with.
Picture Graphs (Pictographs)
Okay so my personal favorite type of graph - picture graphs!
You can introduce them by grabbing any random classroom objects (crayons, glue sticks, counting bears, cubes, anything!) and making a picture graph out of them.
Just make sure the objects are all of a similar size so you can line them up so it doesn't skew the look of the data and make it look like there's more of something just because it's bigger.
When kids are ready to practice picture graphs, I recommend starting them out with a Level A or Level B worksheet.
I love picture graphs because they're so visual and kids understand them pretty easily. Level A above is really straightforward while Level B has them answer a pesky "How many more?" question as well as make them think to answer the "How many kids are in our class?" question.
For your kids who need a challenge, I included a lot of deeper thinking questions. They're all questions you could do whole group with everyone since they're a lot like what kids would encounter on a test but all those questions at once would probably be overwhelming for the average first grader so I'd keep it for your higher kids only if it's independent practice. It'd be a great sheet to do in small groups with your on level groups though! They can definitely do it with a little support. :)
Okay so this is a super fun picture graphs math center - Race to Graph!
Your kids will LOVE It and they can play it over and over for new races! I love centers kids can play over and over because I think students should do any center multiple times... every time they do it, they're increasing their understanding.
Give your students the car dice, the Race to Graph racing mat (laminate it or put it in a sheet protector), and a dry erase marker. Have them roll the dice to figure out which car color to color in on their mat with the dry erase marker to create their picture graph. They keep rolling until one of the cars wins the race by having its full row colored in! I think it's fun if they "bet" on a color car first with their partner.
If you want to have them record their results, give them the A level recording sheet to color in the cars (have them use the crayon colors of the cars to color it in) and total their answers at the bottom.
If you want them to also analyze the data, give them the level B worksheet for on level practice or the level C worksheet for students who need a challenge. For kids who struggle, I recommend doing just the A sheet. For on level kids, they can do A and B or just B. For advanced kids, they can do A and C or just C. This is the Level B data analysis sheet:
And, of course, cutting and pasting fun! Have kids look at the data table at the top to figure out how many of each fish to give each person. You can have them color each person's fish a different color to help them build it if you want. I love these because they're fun AND a perfect assessment. You can see who understands what a picture graph means... and it's tricky! There are 4 extra fish they don't need so they'll be challenged to realize that they don't use all of the fish to make their chart.
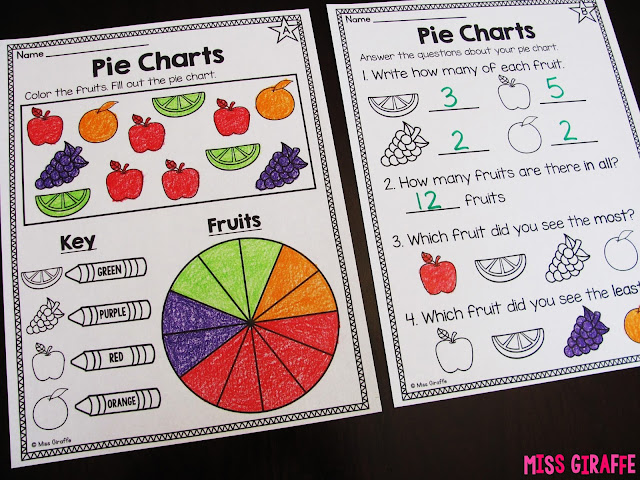
The easiest way to teach pie charts is to just show them a pie chart and talk about it. I like to use this "Our Favorite Food" visual because it's simple. Explain how you asked the class their favorite food and these were the results. Ask them which food has the biggest chunk of the pie - that must be the category we like the most! Ask which has the smallest chunk of the pie, etc. to talk about it.
Now it's time to make our own pie chart! Making their own is what really solidifies the concept. Give them a pie chart building worksheet where they look at the picture (data) and color each fruit the crayon color it says to. Then, they'll color in a slice of their pie chart according to how many of that fruit there were. For example, they colored 5 apples red so they would color in 5 slices on their piece chart red. They colored in 3 lime wedges green so they'd color in 3 slices of their pie chart green. When they're all done, they've made their very own pie chart!
But, of course, they have to analyze it too! Data analysis sounds like such a scary thing but it really gets so easy for them with practice! It's so nice to have similar questions for all of the different graph types, too, so that they are comfortable with what it's asking and just have to apply it to the new type of graph. For the Level B data analysis worksheet (above on the right), they write how many of each fruit, how many in all, which they saw the most, and which they saw the least.
Level C has a lot more questions! By this point in your graphing unit, you could give this worksheet to all of them because they've had a lot of practice with questions like this!
Here's another do again and again (and again and again) math center you can do...
Roll a Pie Chart!
For this center, kids simply roll the crayon dice to tell them what color to color in each circle on their paper. They roll a red crayon/color in a circle red, roll a green crayon/color in a circle green, roll a blue crayon/color in a circle blue, etc. until all of their circles in the line are colored in. Once they've filled all their circles in the line, they make a pie chart with their data and answer the 2 questions. Super simple :) I love centers you can do over and over like this for a ton of practice.
You can also hang up a poster or anchor chart like this as a reference. I also made this poster in black and white so students can color it and put it in their math folders.
I also like to have reference posters of each graph type to hang up so kids can quickly reference!
When kids are ready to practice picture graphs, I recommend starting them out with a Level A or Level B worksheet.
I love picture graphs because they're so visual and kids understand them pretty easily. Level A above is really straightforward while Level B has them answer a pesky "How many more?" question as well as make them think to answer the "How many kids are in our class?" question.
For your kids who need a challenge, I included a lot of deeper thinking questions. They're all questions you could do whole group with everyone since they're a lot like what kids would encounter on a test but all those questions at once would probably be overwhelming for the average first grader so I'd keep it for your higher kids only if it's independent practice. It'd be a great sheet to do in small groups with your on level groups though! They can definitely do it with a little support. :)
Okay so this is a super fun picture graphs math center - Race to Graph!
Your kids will LOVE It and they can play it over and over for new races! I love centers kids can play over and over because I think students should do any center multiple times... every time they do it, they're increasing their understanding.
Give your students the car dice, the Race to Graph racing mat (laminate it or put it in a sheet protector), and a dry erase marker. Have them roll the dice to figure out which car color to color in on their mat with the dry erase marker to create their picture graph. They keep rolling until one of the cars wins the race by having its full row colored in! I think it's fun if they "bet" on a color car first with their partner.
If you want to have them record their results, give them the A level recording sheet to color in the cars (have them use the crayon colors of the cars to color it in) and total their answers at the bottom.
If you want them to also analyze the data, give them the level B worksheet for on level practice or the level C worksheet for students who need a challenge. For kids who struggle, I recommend doing just the A sheet. For on level kids, they can do A and B or just B. For advanced kids, they can do A and C or just C. This is the Level B data analysis sheet:
And, of course, cutting and pasting fun! Have kids look at the data table at the top to figure out how many of each fish to give each person. You can have them color each person's fish a different color to help them build it if you want. I love these because they're fun AND a perfect assessment. You can see who understands what a picture graph means... and it's tricky! There are 4 extra fish they don't need so they'll be challenged to realize that they don't use all of the fish to make their chart.
Pie Charts
Pie Charts are also a lot of fun because they're visual... and who doesn't love pie?The easiest way to teach pie charts is to just show them a pie chart and talk about it. I like to use this "Our Favorite Food" visual because it's simple. Explain how you asked the class their favorite food and these were the results. Ask them which food has the biggest chunk of the pie - that must be the category we like the most! Ask which has the smallest chunk of the pie, etc. to talk about it.
Now it's time to make our own pie chart! Making their own is what really solidifies the concept. Give them a pie chart building worksheet where they look at the picture (data) and color each fruit the crayon color it says to. Then, they'll color in a slice of their pie chart according to how many of that fruit there were. For example, they colored 5 apples red so they would color in 5 slices on their piece chart red. They colored in 3 lime wedges green so they'd color in 3 slices of their pie chart green. When they're all done, they've made their very own pie chart!
But, of course, they have to analyze it too! Data analysis sounds like such a scary thing but it really gets so easy for them with practice! It's so nice to have similar questions for all of the different graph types, too, so that they are comfortable with what it's asking and just have to apply it to the new type of graph. For the Level B data analysis worksheet (above on the right), they write how many of each fruit, how many in all, which they saw the most, and which they saw the least.
Level C has a lot more questions! By this point in your graphing unit, you could give this worksheet to all of them because they've had a lot of practice with questions like this!
Here's another do again and again (and again and again) math center you can do...
Roll a Pie Chart!
For this center, kids simply roll the crayon dice to tell them what color to color in each circle on their paper. They roll a red crayon/color in a circle red, roll a green crayon/color in a circle green, roll a blue crayon/color in a circle blue, etc. until all of their circles in the line are colored in. Once they've filled all their circles in the line, they make a pie chart with their data and answer the 2 questions. Super simple :) I love centers you can do over and over like this for a ton of practice.
Types of Graphs
So now we've practiced all 4 types of graphs we learn in first grade! Do they remember what they're called? I like to have a few sheets to practice this so they remember the names of them:You can also hang up a poster or anchor chart like this as a reference. I also made this poster in black and white so students can color it and put it in their math folders.
Now that they know all 4 types of graphs, I think another important skill is being able to display data in multiple ways with different graph types.... so in comes the assessment!
As you know from my math units, I always include 3 versions of every unit test. Here's one of them!
They have to look at the data and express it in 3 different types of graphs: bar graph, tally chart, and pie chart.
Then, they answer the questions about their graphs!
As you know from my math units, I always include 3 versions of every unit test. Here's one of them!
They have to look at the data and express it in 3 different types of graphs: bar graph, tally chart, and pie chart.
Then, they answer the questions about their graphs!
Like I said, there are 3 of the tests so you could easy do pre-, mid-, and post- assessments. You could also give the test at the end of the unit to figure out who you need to reteach to in small groups and use another test after reteaching to see if it stuck. What I actually recommend is doing a pre-test, post-test, and then saving the 3rd test in a stack with the 3rd tests from the other math units you did that quarter to do a big quarter test at the end of each quarter. It makes a great formative assessment for report cards! You could also save one of the tests for review work packets. There's lots of options!
There's also a sheet to test labeling the parts of a graph and identifying the types of graphs but I think I've maxed out the amount of pictures one should use on a post :) I hope it loaded quickly for you!
I hope you loved reading about graphing!!!
Want EVERY SINGLE ACTIVITY from this post??
Get it here:
First Grade Math Unit 16: Graphing and Data Analysis
It also comes in a UK spelling version for my friends around the world that is already included in the file!
I have math units like this for all the first grade math concepts! I bundled them at a super deep discount (if you buy both bundles, that's like getting almost FIVE entire units free so they're definitely worth checking out if you want your whole year in math planned!):
Check out some of these fun posts:
Building Number Sense
Place Value
Telling Time
Fractions
Adding 3 Numbers
Fact Fluency
Making a 10 to Add
Money (available in U.S., Australian, U.K., and Canadian coins!)
Composing Shapes
Follow me on Pinterest for more teaching ideas!
Also - don't forget to join Miss Giraffe's Class so you never miss out on fun ideas and exclusive free stuff from me only for subscribers!
Here's a picture for you to pin if you want to save this article to read again later! :)
